The material covers the second part of Section E of the scheme of work, which is the second block of elements of 3.1.4 of the specification.
The exercises this week are the same as last week, only instead of calculating modes, medians and means you should calculate ranges, quartiles (and IQR) and standard deviations.
This week there is an ink exercise. This is a proper piece of homework and will have to be handed in next week. Click the link to download the exercise, Statistics Exercise.
Click to download the presentation and a copy of last week's exercises.
 |
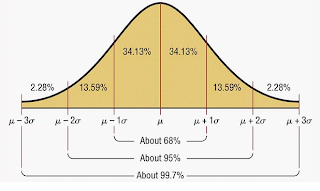
| There's no such thing as an interesting or funny picture about standard deviation, so here's a Normal distribution curve instead... |
No comments:
Post a Comment