Some revision for the mock exam on Tuesday...
Use the questions in your GCSE book and you can download the paper and mark scheme from 2008 here; exam paper and mark scheme.
No pictures, no jokes, no humorous captions... just revise!!!
We're Doing Stats!
Sunday, 28 April 2013
Tuesday, 15 January 2013
Week 8 - Summary Statistics, Time Series and bits and pieces
Its been a long time since the last class, with Christmas, New Year and GCSE Science assessments...
This week we're basically looking to finish off all the bits and pieces that haven't fit in anywhere else.We'll consider the use of time series to establish trends and variations in longitudinal data, we'll look at population statistics, indexed numbers and weighted averages. There are also one or two odd charts and graphs that don't often come up in day to day use (like control charts).
The material mainly covers sections G and H of the scheme of work and completes sections 3.1.3 and 3.1.4 of the specification.
To download the presentation click here and this week's exercises are from the AQA Higher Tier examination from 2007 (the rest of which will form homework...).
There was going to be really cool picture and joke here but Blogger wouldn't let me upload it :-(
Tuesday, 4 December 2012
Week 7 - Not more charts and graphs!!!
This week is all about some of the charts and graphs we can use for interpreting data and statistical measures. We will look at cumulative frequency graphs and polygons and use them to estimate medians and quartiles. We will use box and whisker plots to compare distributions. We will plot scatter graphs for bivariate data, estimate their lines of best fit and interpolate and extrapolate results from the graphs. Finally we will learn how to calculate and interpret correlation coefficients for bivariate data.
This content is Sections E and F of the scheme of work, which is pretty much finishing off parts 3.1.3 and a bit of 3.1.4 of the specification.
To download the presentation click here, and to download this week's exercises click here.
This content is Sections E and F of the scheme of work, which is pretty much finishing off parts 3.1.3 and a bit of 3.1.4 of the specification.
To download the presentation click here, and to download this week's exercises click here.
 |
| Chances are, you don't get it. That just means you have to study harder... Strip from xkcd.com |
Tuesday, 27 November 2012
Week 6 - Quick! Disperse!
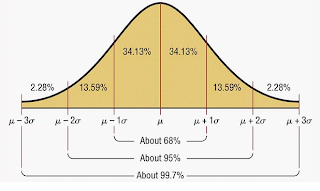
This week is all about measures of dispersion. Most of the work is about measuring the spread of data from the average. We will calculate, ranges, quartiles, interquartile ranges and standard deviations for a variety of data. This section also covers Normal distributions, measuring and interpreting skewness and standardised scores.
The material covers the second part of Section E of the scheme of work, which is the second block of elements of 3.1.4 of the specification.
The exercises this week are the same as last week, only instead of calculating modes, medians and means you should calculate ranges, quartiles (and IQR) and standard deviations.
This week there is an ink exercise. This is a proper piece of homework and will have to be handed in next week. Click the link to download the exercise, Statistics Exercise.
Click to download the presentation and a copy of last week's exercises.
 |
| There's no such thing as an interesting or funny picture about standard deviation, so here's a Normal distribution curve instead... |
Tuesday, 20 November 2012
Week 5 - Moving towards the centre
This week is all about measures of location (working out averages for the statistically-challenged). Most of the work covers an understanding of means, medians and modes and how and when they should be used. There is also content covering the calculation of means from frequency tables and the estimation of means from frequency tables with class intervals.
This material covers the first part of Section D of the scheme of work, which is the very first elements of 3.1.4 of the specification.
Click to download the presentation and the exercises.
This material covers the first part of Section D of the scheme of work, which is the very first elements of 3.1.4 of the specification.
Click to download the presentation and the exercises.
 |
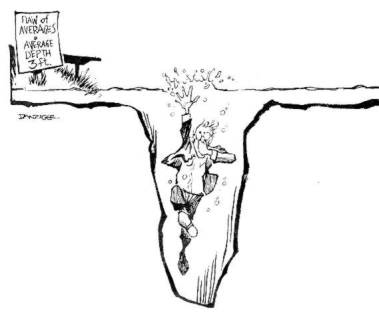
| Technically, a flaw of the mean. If he'd calculated the median depth... Cartoon by Jeff Danziger |
Tuesday, 13 November 2012
Week 4 - Charting the Data
This week is all about drawing pretty graphs! The post is a bit late but you'll need maths instruments for some of the work (a ruler, pair of compasses and a protractor). We'll look at different kinds of diagrammatic representations and when to use them, we'll consider the nature of misleading diagrams and we'll pick out data and results from graphs.
All of this stuff finishes off the 3.1.3 section of the specification (graphical presentation of data).
Click to download the presentation and the exercises.
All of this stuff finishes off the 3.1.3 section of the specification (graphical presentation of data).
Click to download the presentation and the exercises.
 |
| This is probably the wrong type of chart as well... |
Tuesday, 6 November 2012
Week 3 - Tabling the Answers
This week is principally about tabulation. This should be a fairly straightforward topic with most of the content already covered in KS3. We'll be looking at tally charts, frequency and grouped frequency tables, two-way tables and stem and leaf diagrams. Time permitting we'll also get started on graphical presentation, but no promises...
The content covers all of the tabulation elements in 3.1.3 of the specification as well as touching on some of the diagrammatic representation elements.
Download or view the presentation; the sample data for the classwork and the homework sheet.
The content covers all of the tabulation elements in 3.1.3 of the specification as well as touching on some of the diagrammatic representation elements.
Download or view the presentation; the sample data for the classwork and the homework sheet.
 |
| Probably not the right sort of table... |
Subscribe to:
Comments (Atom)